Start by using NOAA’s data
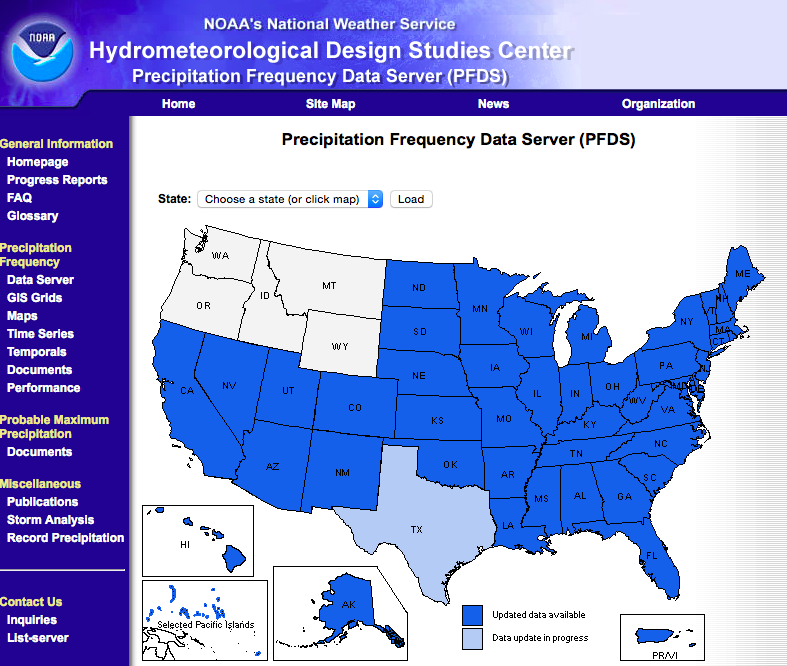
The best resource we've found for rainfall intensity data is NOAA's Hydrometeorological Design Studies Center Precipitation Frequency Data Server.
Start by choosing your state from the U.S. map. Depending on your state, there are two different step-by-step processes. Blue-colored states allow you to search the database, and provide easy-to-read data tables. Gray-colored states require you to determine the value for your site by reading isopluvial maps. We’ll explain both, step by step.

For blue states
Step 1. Choose “precipitation intensity” under Data Type

Step 2. Select location by either selecting a data site close to your property from the dropdown list, entering the latitude and longitude of your property, or clicking on the map.
The below example shows use of the drop-down list for a project site near Chicago’s Midway Airport, where a climate station is located. Entering coordinates or clicking on the map allows selection of precise locations for project sites that are not near to the climate monitoring stations listed in the drop-down menu.
...
0 Comments
Please register to use the forum.